Check traffic police fines in Kazan
| 1,88 | 1,87 | |
| Drag force, N | 697 | 667 |
| Aerodynamic drag coefficient Cx | 0,463 | 0,445 |
| Lifting force, N | –6 | 53 |
| Tipping moment, Nm | 381 | 98 |
| VA3-2110 | VAZ-21103M | |
| Frontal projection area, m2 | 1,93 | 1,98 |
| Drag force, N | 536 | 528 |
| Aerodynamic drag coefficient Cx | 0,347 | 0,333 |
| Lifting force, N | 324 | 190 |
| Tipping moment, Nm | –206 | –193 |
| Discuss the article in the forum |
Car drag coefficient table
Reducing fuel consumption is perhaps the most pressing problem in the modern automotive industry. This consumption depends primarily on an objective factor - various forces of resistance to movement, to overcome which the energy of fuel combustion is expended. Reducing them is one of the ways to save money. Our article is devoted to the reserves contained in improving the aerodynamic properties of a car.
Aerodynamic forces can constitute a significant part of the overall resistance to vehicle movement. If when driving in the urban cycle (average speed 40-50 km/h) they reach 8%, when driving in the suburban area (average speed 80-90 km/h) - 29%, then on highways - 53%. Note that the higher the speed, the faster the wind losses grow: already at 60 km/h they take up more energy than any other component. The fact is that the power spent on overcoming aerodynamic drag is proportional to the cube of the speed; This means that if the speed doubles, then the power must increase eightfold.
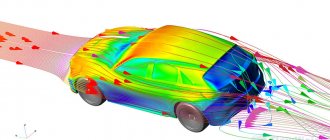
To understand how air resistance arises and affects a car, let’s consider what it consists of. The interaction of air and a car can be represented as the sum of resistances: profile, inductive, internal, as well as frictional resistance and protrusions. The largest “contribution” (about 58%) falls on the profile. It is determined by the shape of the body itself. The air flowing around the car seems to be compressed in front of it, creating significant positive pressure. The flow running along the top of the body repeatedly breaks away from its surface, which creates areas of low pressure in these places. In the rear part, the flow finally breaks away from the body. A powerful vortex wake and an area of large negative pressures are formed there. Positive pressure in front of the car and negative pressure behind it impede movement, creating pressure resistance, or profile air resistance.
Inductive reactance (8% of the total balance) is caused by the difference in pressure on the upper and lower parts of the body. As a result of their interaction, a force arises that pushes the car off the ground - lifting. Although it reduces rolling resistance, its effect on the driving performance of the car is generally negative - it reduces the adhesion force of the wheels to the road, which entails a deterioration in handling.
Protrusion resistance (13% of all losses). Obviously, any protruding part of the car (mirror, antenna, door handles, etc.) contributes to the total aerodynamic drag. Thus, a roof rack at a speed of 60 km/h increases it by 10-12%, which is why fuel consumption increases by 2-3%. Experts from a number of companies believe that just changing such parts can improve fuel efficiency by 3-4%.
Dependence of fuel consumption (l/100 km) on speed (km/h) at different drag coefficients for a passenger car with a curb weight of 1000 kg and a power of 75 hp/55 kW.
Friction resistance (11% of all losses) is caused by layers of air “sticking” to the surface of the body, as a result of which the flow near it loses speed. Energy losses due to surface friction depend mainly on the quality of the body finish. In any case, experiments have shown that if for a new polished car it is about 8% of the total air resistance, then for a poorly painted one with a rough surface it increases by 2-2.5 times. In particular, surface friction increases noticeably when the roof is covered with fashionable granulated vinyl leatherette.
Internal resistance (10% of all losses) occurs when air passes through cooling and ventilation systems. The nature of these losses is such that the ability to reduce them is currently very problematic.
A quantitative characteristic of the total aerodynamic drag is the so-called drag coefficient - Cx, which is usually determined experimentally. To do this, a car or its reduced model is installed in a wind tunnel and the air flow around it is simulated. Some road test methods are less accurate.
The drag coefficient of passenger cars produced by different companies in the 70s and 80s ranges (see table) from 0.30 to 0.60. On average it is currently 0.43. For comparison: the average Cx value for cars produced in 1938 is 0.58. The lowest coefficient is for cars intended to set speed records - 0.2 (Zvezda-6, USSR) and 0.15 (Volkswagen-ARFV, Germany).
Formation of vortices when air flows around the front part of the body.
Let's return to the question of the cost of power and fuel to overcome air resistance. The graph on the tab shows how they are affected by changes in the drag coefficient at different speeds. In modern models, there is a clearly noticeable tendency to reduce it, achieved through constructive measures (see sidebar). According to calculations carried out abroad, with a decrease in Cx by only 0.01, fuel savings in terms of the entire fleet of passenger cars in England (about 10 million) will amount to almost 70 million liters per year (the engine displacement is assumed to be 1200 cm3, and the average annual mileage of each cars - 16 thousand kilometers). Now, when we imagine what Cx means for fuel economy, the following data will also be of interest: additional headlights in front of the radiator lining increase it by 0.04, mudguards on all wheels - by 0.03, an extended antenna - by 0.02, outside rear view mirror - by 0.01, not retracted windshield wipers - by 0.007. All this additional equipment plus a roof rack can raise the total Cx value, say, for a VAZ-2105 from 0.43 to 0.58, and this means consuming an extra 1-1.5 liters of gasoline per 100 kilometers. The figure is convincing enough to take into account the aerodynamic characteristics of the car both in operation and, above all, at the design stage. It is no coincidence that attention to research in this area has increased significantly in recent years.
What is aerodynamic drag?
The fact is that when the car moves in front, the oncoming air is compressed and thereby creates an area with increased air pressure. Due to the pressure, the air flow moves to the rear of the car, which slides along the contour. Since the rear air leaves the car body, an area of low pressure is formed there, where air is constantly sucked in from the surrounding space. A clear example of such formation is the dust that predominates in the rear of the car.
It is noteworthy that the further and later the air is released from the body (the longer the body), the smaller the area of low pressure.
An interesting fact: when two cars (mostly high-speed supercars) drive closely behind each other, the area of low air pressure decreases, and by forming one single whole, both cars receive less drag and, as a result, can gain higher speed. This can be clearly seen in the games Need For Speed and others.
Local resistance coefficient
First, let's define the local resistance coefficient. Local resistances are called point pressure losses associated with changes in the flow structure. There are many components in ventilation that play the role of local resistance:
- air duct rotation,
- narrowing or widening of the flow,
- air entry into the air intake shaft;
- “tee” and “cross”;
- supply and exhaust grilles and air distributors;
- air distributors;
- diffuser;
- dampers, etc.
Their KMS are calculated using certain formulas, and then they participate in determining local pressure losses. In mathematical terms, the local loss coefficient is the ratio of the loss of a known pressure in local resistance to the velocity pressure.
The coefficient of local resistance depends on the shape and type of local resistance, the roughness of the air duct and, oddly enough, on the Reynolds number. For dampers and other shut-off valves, the opening degree is added to the above.
The relationship between the CMR and the Reynolds number is expressed in the formula
Values of coefficients B
for some local resistances
The larger the Re number, the less the coefficient depends on it. Complete independence of the local resistance coefficient from the number Re in the ventilation system occurs for sharp transitions at Re > 3000, and for smooth transitions - at Re > 10000.
The total coefficient of local resistance in a section of the air duct is equal to the sum of all local coefficients in this section.
In practice, there is no special time for calculating the CMC, so designers use tables from reference books and other sources. Moreover, why waste a lot of time searching for formulas and calculations if it has already been done for you. Many ]silencers[/anchor], valves and grilles are happy to indicate the value of the local resistance coefficient in catalogs. But, of course, if you haven’t found any data at all, then you need to resort to mathematics.
Lift and downforce
As a result of uneven air flow around the car from different sides, a difference in the speed of its movement occurs.
Effective lift and downforce
The car moves and cuts through the air flow, while part of this flow goes under the car and passes under the bottom, that is, it moves almost in a straight line. But the upper part of the flow has to follow the shape of the body, and it has to travel a greater distance. Because of this, a difference in air speed occurs - the upper part moves faster than the lower part, passing under the car. And since an increase in speed is accompanied by a decrease in pressure, a zone of increased pressure is formed under the bottom, which lifts the car.
Reducing aerodynamic drag
We showed what aerodynamic drag is and what it depends on, but did not indicate how you can influence this characteristic for the better or for the worse.
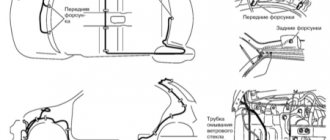
In addition to door handles, fog lights, radio antenna and side mirrors, there are the following elements of the car that affect aerodynamics:
- open windows degrade performance by 5%
- add. installed wheel mudguards by 3%
- roof rack by 10-12%
- wide profile tires by 3%
- sunroof open 5%
- protruding wheel caps also impair aerodynamics.
Not only speed and acceleration, but also vehicle stability and smooth movement depend on well-balanced aerodynamics.
In 2016, I didn’t do much with cars, because I didn’t have time for that - finances sing romances, and becoming a father I slightly moderated my selfish desires. So the car just drives, because in the first 2 years of ownership I brought it to perfection. Next year, 2022, I’m actually planning some improvements, but we’ll see. In the meantime, I decided to raise a purely theoretical topic. TAZ manufacturers tune any car - they do whatever is available. Where to go? Often, tuning cans is done because there is a burning desire, but there are no large funds. BUT you need to understand that LADA is initially a budget car, plus it is often quite outdated in design, so such important indicators as body rigidity and aerodynamics leave much to be desired. BUT again, as I wrote above, people don’t have money, and no one thinks about it. But even among the frets there are more successful ones, and very weak ones. Since I paid attention to these issues in advance, I already know that the Kalina is a modern car by Russian standards, and when choosing, I deliberately looked for the Kalina, since I almost didn’t get enough money for a Priora in good condition (which I’ve been happy about for a long time, because I think Viburnum is generally better than Priors), but I didn’t even look at models like 2114, because I knew that it was as tough and safe as a tin can. So let’s compare the viburnum with other Russian cars and budget foreign cars. LET'S GO!
BODY TORSIONAL RIGIDITY (Nm/deg.)
If I brought the weight for interest, and this indicator is actually secondary, then the rigidity of the body is the most important point when talking about the handling and safety of the car, and durability.
Although there are many other things that affect safety, a rigid body is the basis of passive safety. The plant directly kept silent about the rigidity of the LADA Kaliza body, releasing the following data: “It uses 12% of the body weight parts made of high-strength steel; 65% of the surfaces of parts are zinc-coated versus 33% on the Lada 110 (due to the wider use of double-sided galvanized steels). The torsional rigidity of the body of the new car is 20% higher than that of the “ten.”
If we take the official data for the tenth family and remember this 20%, plus look at the data for the grant, which is essentially the same as Kalina 1, we get a body rigidity of about 10,000 Nm/deg. Is this a lot or not? It’s normal for Lada, Kalina is among the leaders, BUT by modern standards it’s frankly not enough. Even budget modern foreign cars have a stiffness of about 15-20,000. Results of body stiffness measurements at AvtoVAZ UEC (Schenck stand, assembled car, doors, hood and trunk lid open)
For comparison, here are a couple of numbers: MZMA-400 Moskvich 2500 Ford Fiesta 1995 3-door hatchback 6500 Ford Focus 5d mk1 17,900 Nm/deg BMW E36 Touring 10,900 Nm/deg Daewoo Lanos 1997 3-door hatchback 10500 Fiat Punto 3d 19700 Pe ugeot 407 22700 VW Golf V GTI 25000 Porsche 911 Turbo (2000) – 13500 Audi TT – 10000 Roadster BMW Z4 – 14500 Rolls-Royce Phantom 40500 Toyota Prius 2001 22700 VAZ-21106 (racing with frame) 51800 FULL TABLE: topruscar. ru/terms/ zhestkost-kuzova RESULT:
Kalina 1, by the standards of Russian models, still has excellent torsional rigidity of the body, significantly ahead of all previous models, especially our beloved “boyish” caps. Kalina 2 and Granta are essentially the same Kalina, and only the Vesta made a serious leap in terms of body rigidity, but I think the Kalina NFR, due to the subframe, added 2 thousand in this indicator. But you can compare with foreign cars only if we are talking about foreign cars from the 90s, maximum the early 2000s. And there’s nothing much to brag about. Although some budget foreign cars such as the Hyundai Salaris do not show these figures at all, I think in particular because there is also nothing to brag about. So, returning to my entry in the bortovik about installing a strut - body rigidity is never superfluous, especially for Russian cars, and certainly all sorts of Samaras. So the installation of all sorts of struts, body reinforcements and other things from the point of view of body rigidity is a topic. Although from a security point of view, everything is not so clear.
DRAG COEFFICIENT (Cx)
Cx. is a dimensionless quantity that reflects the ratio of the force of air resistance to the movement of the car to the force of resistance to the movement of the cylinder. The lower the Cx, the better the aerodynamics of the car. To put it simply, the drag coefficient is how easily a car cuts the air flow, how much resistance there is when it rushes at speed. This data is also not difficult to find, since all modern cars are carefully studied from this point of view, since it affects speed characteristics, fuel economy, and aerodynamic noise. Russian cars have made a breakthrough in the area of aerodynamics, starting with the 10th family and onwards. There is some kind of mistake in the data available specifically for viburnum - they distinguish between viburnum in the “norm” and “luxury” versions, although these modifications differ only in the presence of all sorts of options, and in terms of bumpers and clearance, everything is the same. So here either they meant a Kalina sedan/hatchback, or a regular Kalina and a Kalina Sport, since the sport has a different body kit and less ground clearance. In any case, the drag coefficient of the Kalina family is again in the leading position among Russian cars, clearly ahead only of the Priora, which was a development of an already very successful dozen in this regard.
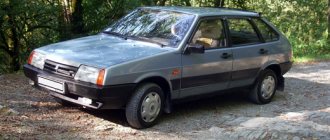
We check the aerodynamics of VAZ-2107, VAZ-21099 and VAZ-2110 cars
The topic of this aerodynamic research has long been, as they say, in the air, the resistance of which at high speeds consumes the lion's share of fuel. Indeed, isn’t it interesting to find out exactly what aerodynamic characteristics VAZ cars of different generations have? Therefore, we decided to “blow” three sedans from Tolyatti in the wind tunnel of the Dmitrov Automotive Test Site - VAZ-2107, VAZ-21099 and VAZ-2110.
So, “seven”, “ninety-nine”, “ten”. Do we need to explain why we chose sedan cars? Among the cars of the “eighth” family there are no station wagons, and among the rear-wheel drive Zhiguli there are no hatchbacks. So it turns out that the sedan is the only body type common to three generations of cars from Togliatti.
Why "seven"? After all, it was the VAZ-2107 that in 1982 became the “flagship” of the VAZ “classic” model line - it was the one to defend the banners of the old guard.
All three cars we selected for the aerodynamic test were new and stock. Mudguards are only behind the rear wheels, two rear-view mirrors each for the “ten” and “ninety-nine”, and only one on the left for the “seven”. And no additional moldings or spoilers.
After measuring the area of the largest frontal projection (the midsection area), the cars were one by one “blown through” in the working part of the wind tunnel at an air flow speed of 40 m/s (144 km/h). At the same time, the forces acting on the machines were recorded by the most precise precision scales.
Source of the article: https://autoreview.ru/articles/kak-eto-rabotaet/vaz-dinamika-aerodinamiki